
yokesky/dsh-usage-lens
usage statistics dashboard: GitHub-style heatmap, daily token trend, model usage donut.
이것은 DeepSeek Harness(DSH) 플러그인입니다. 이 사이트는 GitHub README, 설치 정보, 유지보수 상태, 공개 보안 시그널을 모아 보여줍니다.
dsh-usage-lens


DeepSeek Harness(DSH)Web UI 的用量统计面板,风格参考作者喜欢的 ZCode Harness 设计。 安装后,设置面板会新增「用量统计」页面,直观展示你的使用情况。
预览
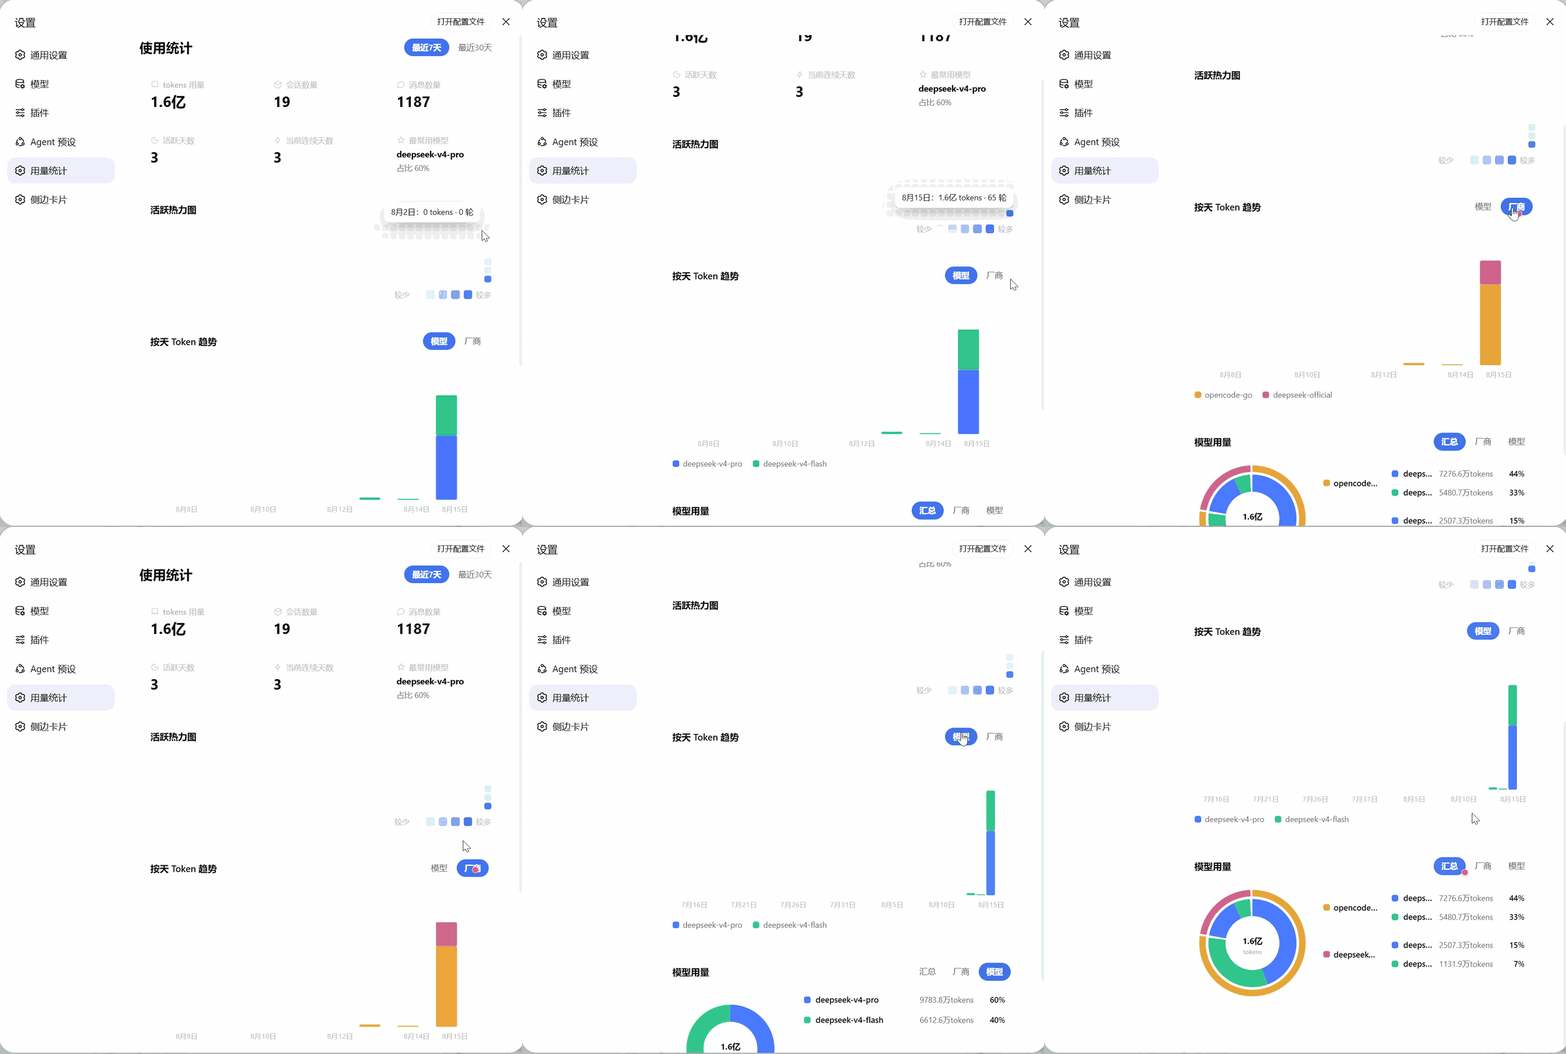
静态截图
功能
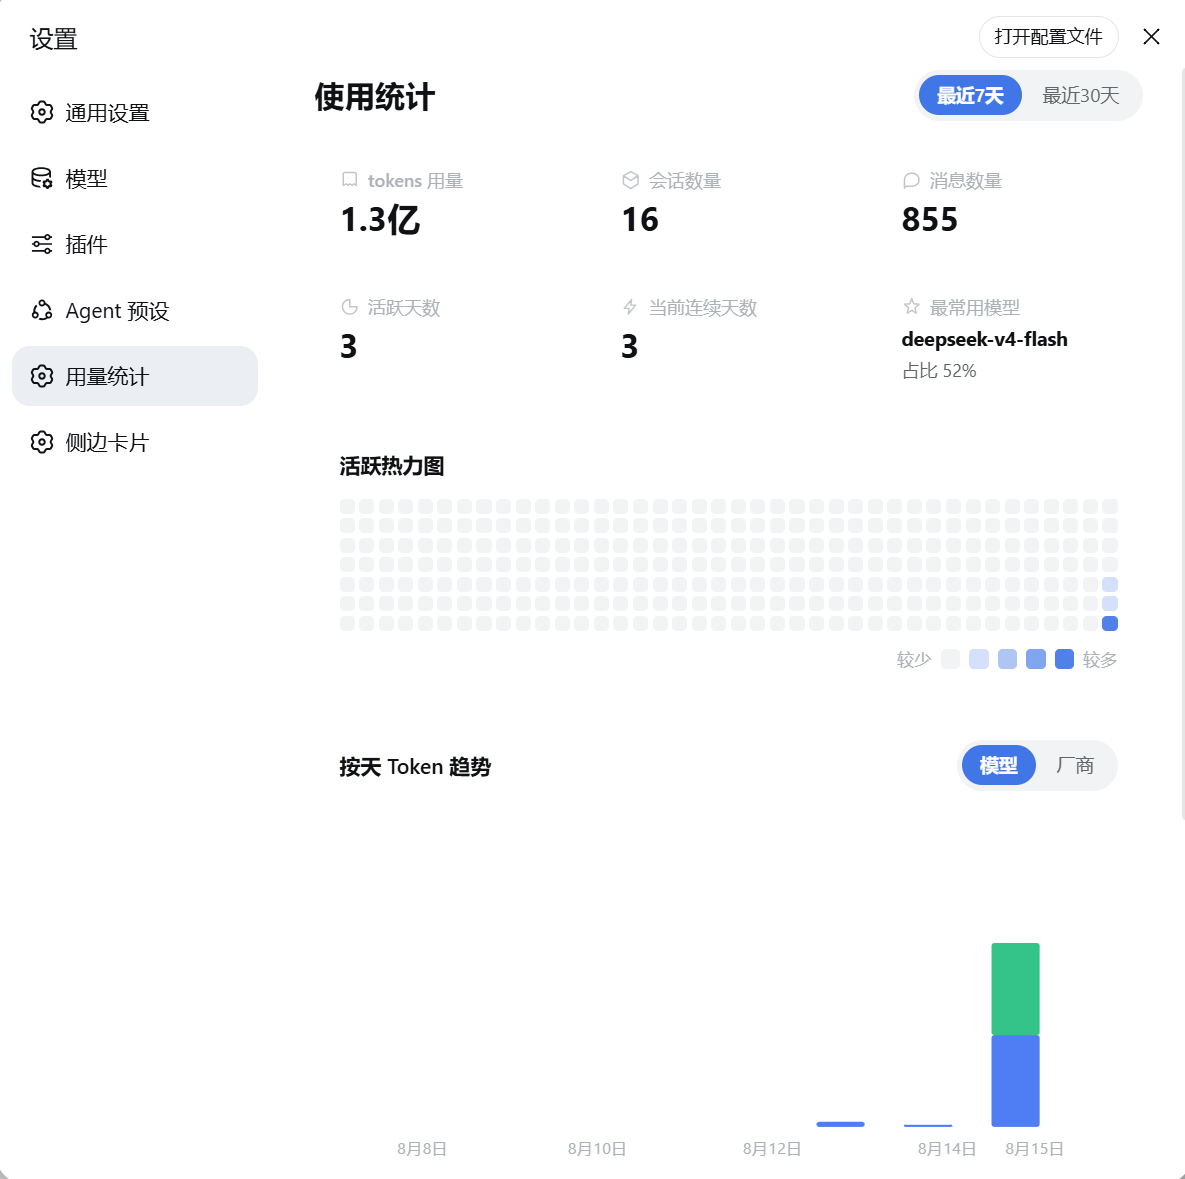
- 总览卡片:tokens 用量、会话数量、消息数量、活跃天数、当前连续天数、最常用模型。
- 活跃热力图:GitHub 风格的 280 天活跃热力图,一眼看清使用节奏。
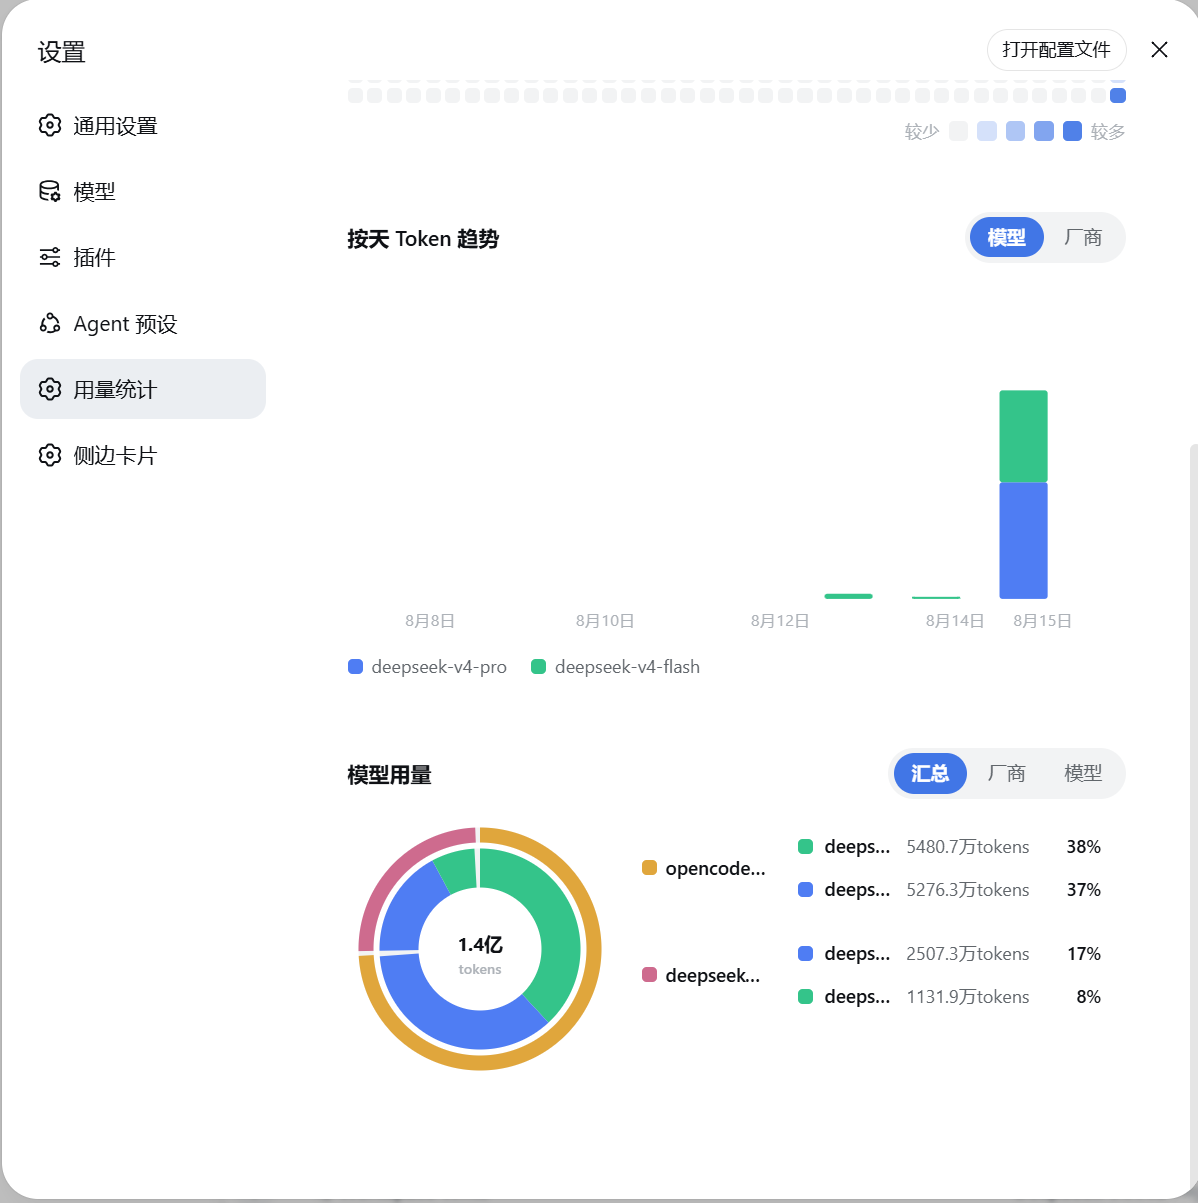
- 每日 Token 趋势:按天查看 token 消耗,可切换「模型 / 厂商」视角。
- 模型用量双环饼图:支持「汇总 / 厂商 / 模型」三种查看方式。
安装
方式一:npm 包
npm install -g @deepseek-ai/dsh   # 先安装 dsh CLI,然后才能执行 dsh 命令
dsh plugin --profile web add @yokesky/dsh-usage-lens
方式二:源码
# 需要已安装 dsh CLI(npm install -g @deepseek-ai/dsh),如已装可跳过
git clone https://github.com/yokesky/dsh-usage-lens.git
cd dsh-usage-lens
pnpm install
pnpm build
dsh plugin --profile web add link:<本仓库绝对路径>
说明:
link:方式指向本地源码,修改代码后重新pnpm build并重启 web 服务即可生效,无需重新安装。也可以直接从本仓库路径安装:dsh plugin --profile web add <本仓库路径>。
安装后
重启 web 服务,打开设置面板即可看到「用量统计」。
English
A usage statistics dashboard for the DeepSeek Harness (DSH) Web UI. Once installed, a new Usage Statistics page appears in Settings.
Features: overview cards (tokens, sessions, messages, active days, current streak, top model), a 280-day GitHub-style activity heatmap, a daily token trend chart with model/provider views, and a model-usage donut chart with summary/provider/model modes.
Install:
npm install -g @deepseek-ai/dsh
dsh plugin --profile web add @yokesky/dsh-usage-lens
Restart the web service, then open Settings → Usage Statistics.
数据说明 / Privacy
- 所有数据来自你本机的 DSH 会话记录,只在本地处理,不会上传到任何地方。
- 面板自动跟随 DSH 的亮色 / 暗色主题。
All data is read from your local DSH session logs and processed locally — nothing is uploaded. The panel follows DSH's light / dark theme automatically.
License
MIT © 2026 yokesky
보안 및 설치 증거
이 점수는 공개 저장소 메타데이터와 이 사이트에 등록된 설치 증거에만 기반하며, 코드 보안 감사와 다릅니다.
공개 플러그인 카탈로그에서 왔으며, 공개 GitHub 저장소로 연결됩니다.
저장소가 MIT 라이선스를 선언했습니다.
최근 180일 내 코드 업데이트가 있습니다.
재현 가능한 정확한 설치 메타데이터가 아직 등록되지 않았습니다. 저장소 설명에 따라 직접 확인하세요.
검사한 패키지 메타데이터에 설치 라이프사이클 스크립트가 선언되지 않았습니다.